Thursday, March 30, 2017

Corporate profits and equity valuation

Today's revision to Q4/16 GDP statistics brought with it our first look at corporate profits for the quarter. My preferred measure (HT: Art Laffer) is after-tax profits adjusted for capital consumption allowances and inventory valuation, and it notched an impressive $1.61 trillion annual rate for the quarter. This measure has been consistently calculated ever since 1947, and as such it represents the most consistent and contemporary measure of the true economic profits of corporate America. Profits by this measure rose by an impressive 15.7% last year, but most of that rebound was due to the waning effects of the severe drop in oil prices which began in mid-2014. Now that the crisis in the oil patch has passed and oil prices are stabilizing, corporate profits are regaining their prior levels, which from an historical perspective are unusually high relative to GDP. Given that profits are historically quite strong, it is worth noting that equity valuations are only modestly above average.


Q4/16 GDP was revised slightly upwards to an annualized rate of 2.1%, which happens to be exactly the same as the annualized rate of growth of the economy since the current recovery began in mid-2009. It's been the slowest recovery on record. As the chart above shows, if the economy had instead regained its long-term average growth rate of 3.1% per year, the economy today would be roughly $3 trillion dollars bigger. I've called that the Obama Gap.


The charts above compare after-tax corporate profits to nominal GDP. It should be clear that despite this being a very weak recovery, corporate profits have been unusually strong. For years I've explained the shortfall in growth as being the result of very weak investment on the part of corporations; without investment their can be no productivity gains, and without productivity there can be no improvement in living standards. Both corporations and consumers have been generally risk-averse for the past 8 years, due to increased regulatory and tax burdens, and a general, anti-business sentiment emanating from Washington. Consumers have deleveraged significantly, while the government has borrowed heavily, absorbing ever penny of the profits generated by corporations since the recovery began. Corporations might have invested that money more efficiently, but instead the government spent most of it on transfer payments.


As the chart above shows, the increase in corporate profits over time has corresponded rather closely to the increase in equity prices. As I argued a few weeks ago, the stock market is not rising simply because of a "Trump bump," it is rising because global economic fundamentals are and have been improving, as is the outlook for corporate profits.


The chart above compares NIPA profits with reported profits (using Bloomberg's calculation of profits from continuing operations). Note that the two measures tend to track each other over time, with the NIPA measure leading the reported profits measure (because it is based on quarterly annualized profits, whereas the reported profits measure uses a 12-mo. trailing average). The rebound in NIPA profits last year is almost certain to show up in rising EPS in the months to come, and the stock market is priced accordingly. Ed Yardeni expands on this subject in a recent post here. For those interested in why the NIPA measure of profits has been consistently higher than the reported measure since the 1990s, see my post of a few years ago on this subject here.


The standard method of calculating equity multiples (PE ratios), is to divide current prices by a trailing 12-mo. average of earnings per share (see the second chart above). I've refined this a bit by using Bloomberg's calculations of PE ratios, which use only profits from continuing operations. A better way, I would argue (as Art Laffer convinced me many many years ago), is to divide current prices by the most recent quarterly annualized rate of profits as calculated in the National Income and Products Accounts (NIPA).  This compares current prices to the most recent measure of true economic profits. I've taken this analysis a step further (see first chart above), and calculated PE ratios for the S&P 500 using the NIPA measure of profits instead of reported corporate earnings (I then normalized the results so that the long-term average PE ratio using NIPA profits would be similar to the average PE ratio using reported profits). By either measure, PE ratios today are modestly or moderately above average, whereas corporate profits using the NIPA calculation are significantly above average. If I had to choose one, I would go with the NIPA version of PE ratios, which shows the equity valuations today are only modestly above average.


The chart above shows the equity risk premium, which I define as the difference between the earnings yield on stocks (i.e., the inverse of the PE ratio) and the yield on 10-yr Treasuries. This is the extra yield that the market demands in order to feel comfortable accepting the added risk of equities vs. risk-free Treasuries. In the boom times of the 1980s and 1990s this risk premium was consistently negative, a sign that the market was quite confident that equities were attractive. But for the duration of the current business cycle expansion, the premium has been consistently positive, a sign that the market has been quite reluctant to take on the added risk of equities. Risk aversion, as I've argued for years, has been one of the hallmarks of this recovery. It's been declining of late as confidence slowly rebuilds, but it would be difficult to argue from this chart that the equity market is priced to optimistic assumptions. I would further note that current risk premiums are about the same as the were in the late 1970s, during the infamous "Carter malaise."

Finally, I would note that these measures of equity valuation have nothing to do with surveys of investor and/or consumer sentiment. They rely solely on market-based measures, and as such, I think they are more reliable and informative.

Monday, March 27, 2017

Household finances are on solid ground

U.S. households' financial burdens (payments for mortgage and consumer debt, auto leases, rents, homeowner's insurance, and property tax, all as a percent of disposable income, are at historically low levels and have not budged for over five years. Moreover, the overall leverage (total liabilities as a percent of total assets) of the household sector is at 30-year lows. Coupled with the fact that weekly claims for unemployment are at historically low levels, this paints a picture of a household sector that is on financially solid ground, more so than at any time in decades.


Today the Fed released data for the fourth quarter of 2016 covering various measures of household's financial burdens. As the chart above shows, financial burdens have been historically low for over 5 years, and are substantially less now than they were prior to the past 3 recessions. I note that consumer debt includes student loans, which now total over $1 trillion and which continue to grow at a significant pace—the only area of consumer finance that is deteriorating, thanks to our beneficent government which is willing to grant student loans with little or no regard for a student's ability to pay.


Households' leverage has plunged by about one-third since the 2008 recession, as the chart above shows, and leverage is now back to levels last seen some three decades ago.


Initial claims for unemployment, shown in the chart above, haven't been so low for a very long time. Workers at social security offices around the country must have a lot of time on their hands these days!


The chart above compares unemployment claims to total payrolls. Here we see that the chances of a worker getting laid off are as low as they have ever been, and by a substantial margin. In recent weeks, only about 0.15% of the U.S. workforce has been handed a pink slip.

Household finances appear to be about as solid as they have ever been, and job security is also about as good as it has ever been. This is not to say we don't have problems, but these statistics are reassuring nonetheless, and not widely recognized.

Friday, March 24, 2017

Thoughts on the failure of Obamacare reform

I don't buy the conventional wisdom that says that this is a failure of leadership. Leadership alone cannot fix Obamacare. A solution to the problem of Obamacare is going to be extremely difficult, and it can't and shouldn't be done overnight. Obamacare was doomed to fail, as I pointed out many times over the years, because it attempted to rejigger a huge fraction of the U.S. economy, and that is something that is virtually impossible to accomplish in a successful fashion by government diktat. Only a freely functioning market economy can make something so huge and so complex work in an efficient manner. (Friedric Hayek, who died 25 years ago, explained why in this post from Mark Perry)

Thank goodness the Republicans didn't end up succumbing to the hubris that energized the Democrats under Nancy Pelosi's leadership, when they passed a bill so huge and so complex that she was forced to exhort its passage in order that they could find out what was in it. Thank goodness the Republicans didn't ram through a bill that had zero support from the opposition party (as Pelosi did), let alone strong support from their own party; that is not the way to accomplish major legislation.

Obamacare is imploding because it attempted to substitute government decree for market forces. So a fix to Obamacare is only going to work if it unburdens the healthcare market from government  influence. Ryan's proposed solution went a long way towards doing that, but it still relied on too much government interference in the healthcare market. Here's my recommendation: Let's put this intractable problem on the back burner; let's let Obamacare continue to fester; and let's wait until the Democrats beg for a solution and join in supporting new and better legislation.

Meanwhile, let's hope the Republicans can regroup and move on to tackle a big problem that should be a lot easier to solve, and which could end up delivering positive results for everyone in relatively short order: tax reform.

Successful tax reform should involve a few simple ingredients: tax rates should be lower and flatter than they are now, and deductions and subsidies should be far fewer. (Please, Republicans, please don't attempt to impose a Border Tax system on the U.S. economy, since that is very complex and it will have many unforeseen consequences, some good and some very bad. Please don't listen to Trump and his economically illiterate trade advisor Peter Navarro.) Lower and flatter tax rates coupled with fewer subsidies and deductions should boost the economy because they will reduce the amount by which the government interferes in private markets, and they will increase the incentives for the private sector to work, invest, and innovate.

Tax reform can deliver a stronger economy, and a stronger economy ought to make it much easier to reform Obamacare.

Friday, March 17, 2017

Global outlook improves

It's not just a Trump Bump that is driving stocks higher, nor is it unwarranted or unsubstantiated optimism. Rising equity prices are most likely a response to an improvement in global economic fundamentals that is just now becoming clear. Global industrial production has been rising for the past 6-8 months, and the volume of global trade picked up noticeably toward the end of last year. More recently, today's release of industrial production statistics for February shows a significant pickup in U.S. manufacturing activity in the first two months of this year. All of this was foreshadowed by a pickup in chemical activity which I noted early last summer and which continues to suggest a meaningful improvement in overall industrial production in the months to come.

The market is usually pretty good at sniffing out developments in the economy that are not yet obvious in the stats, and this is the latest example.

Here are some charts that tell the story:


U.S. industrial production statistics have been unimpressive for years, due mainly to wrenching problems in the oil patch. Eurozone industrial production in the Eurozone has been abysmal relative to modest improvement in the U.S., but it has nevertheless been improving, and this improvement become noticeably stronger about six months or so ago.


After several years of almost zero growth, U.S. manufacturing production has jumped, rising at almost a 5% annualized rate since the end of November.


The volume of world trade is a key indicator of global economic health, since expanding trade is an unalloyed good thing: increased trade is arguably the best way to improve a nation's productivity, since it allows trade partners to strongly benefit from the things they do best. In the chart above we see that world trade volumes rose at a relatively tepid 2-3% pace for a number of years, which is consistent with the recent recovery being the least impressive in modern history. But in the second half of last year world trade volume rose at a 4-5% pace. This is very good news.


The Chemical Activity Barometer has done a pretty good job of reflecting—and sometimes leading—overall economic activity in the U.S. Starting last summer this indicator started picking up, and in the year ending February it has increased by over 5%.


The chart above shows that the year over year change in the 3-mo moving average of the Chemical Activity Barometer has been a reliable predictor of improvement in U.S. industrial production. Industrial production is now beginning to improve, as predicted, having increased modestly since last March after several years of decline. More improvement should be on the way.


The chart above shows the CRB Raw Industrials commodity index, which has been rising strongly since late 2015. It's now apparent that this has been driven not by a weaker dollar (as has typically been the case), but by an unexpected and significant improvement in global economic activity. The CRB Metals index (which consists of copper scrap, lead scrap, steel scrap, zinc, and tin) has surged almost 60% since early last year. Very impressive, and it's still ongoing.


So it's not surprising that Eurozone stocks have perked up of late, as has nearly every global equity market. The current equity rally is built on a sound economic base, not on flights of fancy.

Wednesday, March 15, 2017

Bonds pleased with Fed rate hike

Today the FOMC raised its target Fed funds rate to 1.0% as expected. However, Treasury yields fell 10-20 bps or so in the aftermath of the announcement, suggesting that the bond market had been nervous that the Fed would signal more aggressive rate hikes in the future—which it didn't. Once the dust had settled, we see that 5- and 10-yr Treasury yields are largely unchanged over the past three months, while 2-yr yields are up only 5-10 bps. This further suggests that the Fed and the bond market have been thinking along the same lines for the past several months; the bond market expects the Fed to continue deliver on its promise to raise short-term rates only gradually for the foreseeable future. Whether this expectation holds going forward is the real question at this point, and the answer will depend on the evolution of the economy and inflation. But for now, expectations and reality look to be in rough equilibrium. Not surprisingly, the stock market took heart from the relative calm, as prices firmed.

The charts below are updated versions of charts that I consider key to understanding the evolving stance of monetary policy:


One very important measure of the effective stance of monetary policy is the inflation-adjusted Fed funds target rate. By changing the real level of its funds rate target, the Fed attempts to influence the world's demand for money. Higher real yields are intended to increase the demand for money (while also making borrowing less attractive), whereas lower real rates do the opposite. Given the relative tranquility in the bond market and the economy in recent months, we can infer that the Fed's efforts to date have not made any significant change in the balance between the Fed's supply of money and the market's demand for it. In other words, the Fed's "tightening" actions to date have been largely offset by the market's decreased demand for money, a phenomenon which goes hand in hand with increased confidence and a modestly improved economic outlook. As the chart above shows, the real Fed funds rate (using the core PCE deflator—the Fed's preferred inflation gauge—to discount the nominal Fed funds target) has increased from -2% a few years ago to just above -1% today. That's not really a "tightening," and is better thought of as the Fed becoming "less easy."


The chart above compares the real funds rate (red) with the market's expectation of where the real funds rate will be in 5 years (blue). As long as the future expected rate is higher than the current rate, the bond market is expecting the Fed to continue to raise its target real rate. But when the red line exceeds the blue line—as it did prior to the last two recessions, this is an excellent sign that the market expects that the Fed will sooner or later be forced to lower its target rate because the economy is expected to weaken. An inverted real yield curve (when short-term real rates exceed longer-term real rates) is thus an excellent indicator of a coming recession, and the market's way of telling the Fed that monetary policy is too tight. Today the market is signaling "steady as she goes," which translates into continued moderate and measured increases in short-term rates—much as the Fed is promising.


The chart above gives us another way of measuring the effective stance of monetary policy, by comparing the level of real short rates to the slope of the Treasury curve. When real rates are very high and the yield curve is inverted (i.e., when short-term rates exceed long-term rates) monetary policy is very tight and the economy inevitably succumbs to recession (think of the economy being starved of liquidity and subsequently collapsing). We are likely years away from such a confluence, since real short-term rates are still very low and the yield curve is positively sloped.


The level of expected real short-term rates (blue line) also tells us about the market's willingness to pay up for "safety." As the chart above shows, gold prices and TIPS prices (using the inverse of their real yield as a proxy for their price) have been moving together for many years, and both have been slowly declining since 2012 (when fears of a Eurozone collapse triggering another global recession were intense). This suggests the market has slowly been regaining confidence and losing its risk aversion as the memory of the 2008 crisis fades, the economy proves resilient, and an era of improved fiscal policy approaches. So far, nothing dramatic has happened, and I would argue that both TIPS and gold prices still embody a good deal of caution with regards to the future.


As the chart above shows, the underlying trend of the consumer price index (ex-energy) has been about 2% per year for the past 14 years.


Over the past six months, the core CPI is up at a 2.2% annualized rate, which further suggests that the core PCE deflator is currently rising at just under 2%, which is close enough to the Fed's target to effectively rule out any risk of deflation or fear that the Fed has been raising rates too much or too fast.


The level of expected real short rates (blue) also tells us a lot about the market's expectations for economic growth. Here we see that the recent rise in real short rates is very modest, and that means that growth expectations have only firmed modestly in the past year or so. Conditions today are a far cry from where they were in 2000, when the market fully expected economic growth to average 4% a year or more for the foreseeable future.

Right now it looks like the market is priced to 2-2 ½% growth for the foreseeable future. That further suggests that if Trump manages to deliver decent supply-side policy changes (e.g., significantly reduced regulatory burdens and lower marginal tax rates), and if those policies result in growth of 3-4%, then we ought to expect interest rates to move substantially higher. So far the market is taking a wait-and-see, albeit modestly-optimistic attitude.

Tuesday, March 14, 2017

30-yr fixed mortgage rates on the rise


Those in the market for a fixed-rate mortgage should be sure to study this chart. It's not yet common knowledge that 30-yr fixed conforming mortgage rates hit an all-time low of 3.3% less than 6 months ago, and have since risen to at least 4.2%. It's probably hard to find anything lower than 4.4% today, according to this report (HT Calculated Risk). The days of 3-handle 30-yr mortgage rates are probably a thing of the past.

So will rising mortgage rates kill the housing market? According to Case-Shiller, nationwide housing prices have risen at a 6.5% annualized clip for the past 5 years, and have now eclipsed their 2006 highs.  In real terms, however, housing prices today are still about 15% lower than they were in 2006, as seen in the chart below:


Higher mortgage rates increase the effective cost of owning a home, so at some point higher rates are likely to slow down the housing market. But for now, I would argue that it's best to think that higher rates are a by-product of a stronger economy and stronger demand. Mortgage rates and housing prices are rising because demand for housing remains strong at a time when lenders are becoming less willing to lend at what are still relatively low rates from an historical perspective. It's all part and parcel of increased confidence and stronger growth fundamentals.

Friday, March 10, 2017

February jobs report changes nothing

As I suspected two days ago, there hasn't been any significant change in the labor market. The very strong ADP report was probably just an outlier, and we have seen lots of those over the years. Today's jobs number was stronger than expected (235K vs. 200K), but it's not impressive when viewed from an historical perspective. As the charts below attest, there has been no change in the underlying strength of the labor market. Jobs are growing at just under 2% per year, much as they have for the past several years. 


The chart above compares the monthly change in private sector jobs, as calculated by the BLS and ADP. Lots of noise, but no change in the long-term trend.


The chart above focuses on just the change in private sector jobs as reported by establishments. The best we have seen in recent years are months in which jobs grow by upwards of 250K per month. But in the past 12 months, jobs growth has averaged 178K, and in the past six months 189K. Those are ho-hum numbers.


One bright spot is that the growth of the labor force (those working plus those looking for work) has picked up modestly over the past year or so. But there are still upwards of 10 million people (potentially) who have "dropped out" for a variety of reasons.


As the chart above shows, private sector jobs are rising at a 1.6% - 1.9% annual rate. We're going to need to see several months of over-225K jobs growth before getting excited about a pickup in the economy.


The chart above shows the labor force participation rate (the labor force divided by the total working-age population), which looks to have stopped declining. That's good news, but it's going to have to start rising by a meaningful amount if the economy is to grow by more than 3% a year.

In any event, today's jobs number shouldn't deter the Fed from raising short-term rates to 1% next week. The Fed is still in "normalization" mode, and it's going to be a long time before monetary policy becomes "tight." The bond market is happy with the idea that rates are going to rise. Continued growth in the economy coupled with rising confidence fully justifies a Fed rate hike. 

Thursday, March 9, 2017

Richer than ever

Today the Fed released its Q4/16 estimate of the balance sheets of U.S. households. Collectively, our net worth reached a new high in nominal, real, and per capita terms. We have been struggling through the weakest recovery ever, but at the same time we are better off than ever before, and by a lot.


As of December 31, 2016, the net worth of U.S. households (including that of Non-Profit Organizations, which exist for the benefit of all) reached a staggering $92.8 trillion. That's up $5.5 trillion in just the past year, for an impressive gain of 12%. Of note, household liabilities have increased by only $500 billion since their 2008 peak, for a gain of just 3.4%; the value of real estate holdings is up by about $1.5 trillion (about 6% above that of the "bubble" high of 2006); and financial asset holdings have soared buy $22.3 trillion since pre-crash levels (over 40%), thanks to significant gains in savings deposits, bonds, and equities. The gains in wealth are not just due to a raging stock market, since the market cap of all traded U.S. equities has risen by only $7.7 trillion since their pre-2008 high, according to Bloomberg.


In real terms, household net worth has grown at a 3.5% annualized rate for the past 65 years, as seen in the chart above. That works out to almost a 10-fold gain in wealth, and that's impressive by any standard.


On a real per capita basis (i.e., after adjusting for inflation and population growth), the net worth of the average person living in the U.S. has reached a new all-time high of $286K, up from $62K in 1950. This measure of wealth has been rising, on average, about 2.3% per year since records were first kept beginning in 1951. By this metric, life in the U.S. has been getting better and better for generations.

The ongoing accumulation of wealth is not a house of cards built on a bulging debt bubble either, regardless of what you might hear from the scaremongers. As the chart above shows, the typical household has cut its leverage by one third, from a high of 22.1% in early 2009 to 14.8% by the end of last year. Households have been prudently and impressively strengthening their balance sheets over the past seven years by saving and investing more and by reducing the use of debt financing.

Is this a great country or what?

Wednesday, March 8, 2017

Trends in key asset markets look healthy

In recent months there have been a number of interesting developments in global asset markets. In general it's all good news: the dollar is strengthening, gold is teetering, interest rates are rising, commodities are resilient, equities are rising, credit spreads are narrowing, and emerging markets are recovering. Not everything is rosy, however, but on balance the market's message is that global economic growth is expected to improve for the foreseeable future, while inflation is likely to remain relatively low and stable.

I continue to believe that there is a lot of 
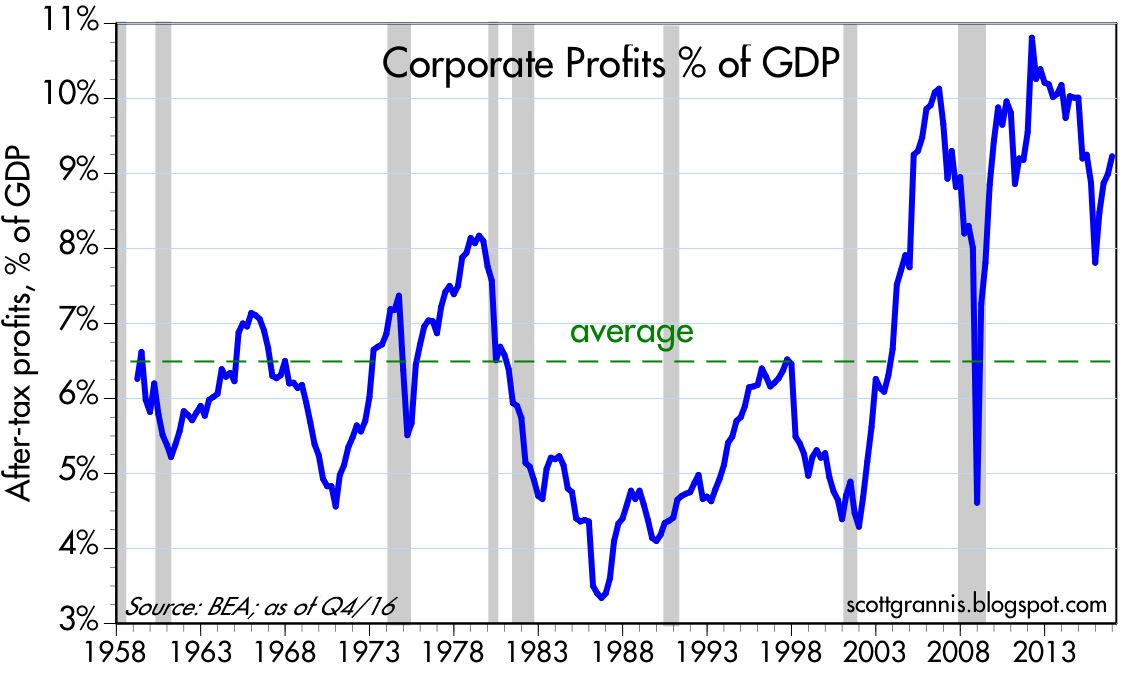
upside potential in the U.S. economy, and I that the outlook for corporate profits is improving now that oil prices are no longer declining and confidence is on the rise. What's changed to make all this possible? The direction of policy: after years or moving in the wrong direction, regulatory burdens going forward are likely to decline, marginal tax rates are likely to decline, the U.S. tax code is likely to be simplified, and markets are likely to become freer and fairer. Trump may not do everything right, but as long as he fixes at least a few things, we'll be better off in the future than we have been in the past.

From my supply-side perspective, this means that the incentives to work, invest, and take risk are on the cusp of rising, and so in coming years we are likely to see more people looking for work, more jobs being created, stronger productivity gains, and expanding trade and prosperity globally. It's hard to say how much improvement there will actually be, but the important thing is that on the margin, things are likely to improve. That's what moves markets: the direction of change on the margin relative to expectations for change.

Here are 20+ charts that tell the story:


The value of the dollar is arguably one of the most important financial variables, since it is effectively the price of admission to the world's biggest, wealthiest, and most influential economy. A rising dollar is thus a good sign that the world is more interested in gaining exposure to our economy, and that in turn means more investment and more growth—it's a virtuous cycle. The chart above is arguably the best measure of the dollar's value vis a vis other currencies, since it is calculated on a trade-weighted, inflation-adjusted basis. It was only a few years ago that the dollar was scraping the bottom of the barrel, trading at all-time lows. Back then it was far from clear whether the U.S. would ever recover its former glory, or ever manage to grow by more than 2% a year. Today, in contrast, animal spirits are making a comeback. Hope is returning.


Today's ADP employment report, which far exceeded expectations, was at least a partial sign of a revival in animal spirits. But as the chart above shows, we have seen quite a few spikes like this in prior years, only to have them reversed in subsequent months. In other words, it's too early to be confident in a significant and lasting pickup in hiring. Nevertheless, since this report comes on the heels of a very strong jump in Small Business Optimism (second chart above), it is reasonable to be optimistic.


History tells us that the value of the dollar and the price of commodities tend to move in opposite directions (see chart above, which compares commodity prices to the inverse of the dollar's value). It's rare that commodity prices should be as strong as they are today given the dollar's impressive rise in recent years. I continue to believe that this signals that a stronger dollar is a harbinger of a stronger U.S. economy and a stronger global economy, and that is what is keeping commodity prices resilient.


Credit Default Swap spreads, shown in the chart above, are a highly liquid market that is an excellent proxy for the market's outlook for corporate creditworthiness. Spreads today are as low as they have been for many years, but they are not yet at the rock-bottom lows we saw in the late 1980s. The message is simple: the market is not very worried about creditworthiness, presumably because the outlook for the economy has improved and there are as yet no signs of deterioration. If there's anything to worry about, it's that spreads are relatively narrow, and that is a sign of optimism. And when optimism is high the market becomes vulnerable to anything that is not good news.


Swap spreads, shown in the chart above, are a unique form of credit spread because they reflect both the health and the liquidity of the financial markets and they are often good leading indicators of the health of the economy. Swap spreads are the market's way of charging for generic risk when entering into large and complex financial transactions with major financial participants. That swap spreads both here and in the Eurozone are rising is therefore a reason to worry. I hasten to note, however, that U.S. swaps spreads, currently about 30 bps, are still within a "normal" range, which would be 20-30 bps. The time to worry is when swap spreads exceed 50-60 bps. Unfortunately, Eurozone swap spreads are now in the worry zone. I think this probably reflects rising concerns in Europe that the French government may decide to exit the EU (i.e., "Frexit"), and if they do, this could pose significant systemic risk for Eurozone financial markets. I note in that regard that 5-yr CDS spreads on French government bonds have spiked to 60-70 bps in recent months, while German government CDS spreads remain relatively benign. In short, markets are worried that the French could do something "stupid" that might in turn lead to defaulting on its obligations. This bears watching, but it's not yet a reason to panic. The world started to panic over Brexit, but since then it has proven to be more a development that is more salutary than concerning.


The chart above compares swap spreads with the spread on high yield corporate debt. Here we see an anomaly: swap spreads are rising while HY spreads are declining. This could be one of those times when swap spreads are the leading indicator for where the rest of credit spreads are headed. For the time being, however, I am more persuaded by the fact that swap spreads are still pretty normal at current levels, so their recent rise is more in the nature of a return to normalcy than it is to the beginnings of deterioration. If they continue to rise in a meaningful fashion, then I'll start to worry that other credit spreads might rise, and the outlook for the economy would therefore deteriorate.


In the two charts above, we see that Commercial and Industrial Loan growth has slowed down significantly in the past four months, after growing at heady, double-digit rates for years. Is this a cause for concern, or is it simply a return to more normal conditions? A slowdown in loan growth is symptomatic of an increase in the demand for money (because wanting money is the opposite of borrowing money). As such, this may well be a healthy development; banks are not lending willy-nilly, and neither are companies borrowing with abandon. It's also important to remember that lending activity does not necessarily drive economic growth; lending can facilitate growth, but it can't create growth out of thin air. Confidence and investment are the keys to growth, and a slowdown in lending activity could be simply a sign of returning confidence. Meanwhile, we know that there is no shortage of money in the system.


The two charts above suggest that bank lending is on solid ground, at least for now. Delinquency rates for both C&I Loans and all bank loans and leases are historically low. To be sure, delinquency rates are more of a coincident than a leading indicator, since companies typically have problems paying off their debts when the economy is deteriorating or very weak. In other words, recessions are not caused by loan defaults; loan defaults are the result of recessions. In any event, these charts tip the scales in favor of rational lending and borrowing behavior.


The chart above has fascinated me for years, since it shows that the prices of TIPS and golds have been highly correlated (the blue line is the inverse of the real yield on TIPS, which is a good proxy for their price). Both of these disparate assets are moving together: how to explain? My best guess is that they share one key attribute, which is "safety." Gold is a classic refuge from uncertainty, and TIPS are not only default-free but government-guaranteed to protect against inflation. That both appear to be declining on the margin suggests that financial markets are becoming somewhat less risk-averse, presumably because the outlook for growth is improving. If the economy becomes healthier, there is less reason for the Fed to take outsize risks, and thus there is less risk of inflation and less risk of a debasement of the dollar. I'd like to see both assets continue to decline in price.


The chart above compares the real and nominal yield on 10-yr Treasuries, with the spread between the two being the equivalent of the market's expected annual rate of inflation over the next 10 years. Inflation expectations have been "anchored" around 2% for several months now, even as yields have reached new highs for the year. This in turn suggests that it is real rates that are driving all rates higher, which implies that rates are rising because the market's growth expectations are rising (real rates typically rise as economic growth picks up). The rise in real rates is still quite modest, however, but it is encouraging and I would expect to see more of the same in the months to come.  


One reason the dollar is stronger these days is that other currencies have become less attractive (see charts above). Both the Euro and Sterling are now trading "cheap" relative to my estimate of their Purchasing Power Parity vis a vis the dollar. The dollar is not worth more because the Fed has created a shortage of dollars (which would be deflationary); it is worth more because other currencies are worth less. For that reason I doubt that the dollar's strength is a harbinger of rising deflation risk. It's one more sign that the U.S. economy is attracting the world's capital, and that capital can in turn fuel more investment and growth in the years to come.


The chart above shows that a rising dollar can often be a precursor of rising productivity, and vice versa. I think that puts meat on my argument above: if today's stronger dollar is the result of investment inflows, that in turn suggests that we will see rising productivity—and rising prosperity—in the years to come. Very good news.


Peter Navarro, Trump's trade guru, needs to look at these charts before he leads the U.S. into a trade war with China. Contrary to what he thinks (and he's most assuredly wrong on almost everything he says), China has not been keeping its currency artificially weak. As the second chart shows, the Chinese yuan has actually appreciated strongly against the currencies of its trading partners on an inflation-adjusted basis. As the first chart shows, the Chinese central bank was a huge buyer of foreign currency from 1995 through 2014 (accumulating some $4 trillion in forex reserves in the process), yet the yuan was continually appreciating over that same period. If they hadn't bought all that incoming foreign capital, the yuan would have appreciated much more than it did. Things have changed a lot in recent years, however. The Chinese central bank has sold $1 trillion of its forex reserves, yet the currency has depreciated. They been trying to prop up the yuan (by selling assets), but the yuan has nevertheless declined. The fact that their forex reserves have been relatively stable for the past several months suggests that the yuan may have found a new equilibrium. In any event, the yuan is still plenty strong, and even though the economy is only growing 6-7% these days (instead of 10%) it is still relatively impressive when you consider the meager growth of the world's developed economies.


The charts above tell a simple story: the outlook for the U.S. economy has brighter than the outlook for the Eurozone or the Japanese economy in recent years. U.S. stocks are at new highs, but the same can not be said for most other countries.


Finally, a quick look at my favorite Latin American economy, Argentina. These charts are very encouraging, since they show that by liberalizing its currency market and respecting its debts, Argentina has regained a good portion of the world's confidence that it had previously lost. Since abandoning its peso peg in December 2015, the peso on the open market has declined only marginally, even though inflation continues to hover in the 25-30% range. More importantly, the central bank has rebuilt Argentina's foreign exchange reserves dramatically over the past year. This further suggests that we ought to see declining inflation—finally—in Argentina in the years to come. Why? Because the relatively stable peso and the huge surge in Argentina's forex reserves are symptomatic of a big increase in the demand for pesos. So even though currency in circulation has expanded by almost 30% in the past year, its safe to say that the demand for those pesos has also increased significantly. And that means that rapid money growth won't be so inflationary going forward as it has been in the past.